Anomaly Detection is finding abnormal samples from dataset, and it can be used in a lot of places. for example, Finding Defects in Manufacturing, Finding the wrong part of the medical video, etc.
Here is what I’m trying to do in this article:
- What is Time series Anomaly Detection.
- Explain one of deeplearining based Time-series Anomaly Detection model OmniAnomaly
- Train and test OmniAnomaly based on paper authors’ github repo.
What is Time series Anomaly Detection
before start explain about Time series Anomaly Detection, we need to know what is anomaly detection is.
Anomaly detection is a technique used to identify unusual patterns that do not conform to expected behavior, called outliers.
Typically, this is treated as an unsupervised learning problem where the anomalous samples are not known a priori and it is assumed that the majority of the training dataset consists of “normal” data.
the another names if anomaly detection is Novelty Detection, Forgery Detection, Out-of-distribution Detection.
typically there are three types of target data.
- time series data
- image data
- video data
In time-series data, it is aimed to detect a abnormal sections.
In image, video data, it is aimed to classify abnormal images or to segment abnormal regions, for example, defect in some manufacturing data.
Then Time series Anomaly Detection means Anomaly Detection on Time Series data!
Then what is Time series data is?
Time series data is a collection of observations obtained through repeated measurements over time. Plot the points on a graph, and one of your axes would always be time.
time series data is a series of datas which mesured same target’s attribute over time.
Company Influxdata, which developed one of opensource Time series based db software InfluxDB, said that time series data has advantages when used in this way.
- Tracking daily, hourly, or weekly weather data
- Tracking changes in application performance
- Medical devices to visualize vitals in real time
- Tracking network logs
Since time is constituent of everyting that is obserable, we can find time series data everywhere!

some static data can be time series.
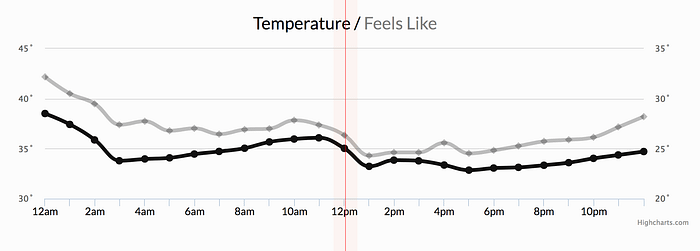
for example, current temperature is a static data, but, when it relates with time data, It can be time series data.
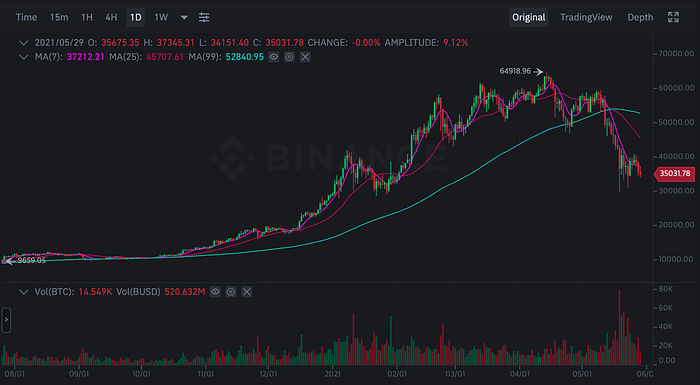
coin values over time can be a another example of time series data, the values of coins changes overtime can be a collection of observations obtained through repeated measurements over time.
About Omnianomaly
OmniAnomaly is an deeplearning network for robust detection and interpretation of multivariate time series of datas.
multivariate time series is a time series data which hash multiple variables in each time, for example, in case of computer system log, there can be multiple values at each time(ex. cpu usage, gpu usage, memory usage… etc.).
the model was introduced in paper “Robust Anomaly Detection for Multivariate Time Series through Stochastic Recurrent Neural Network”.
following image is the structure of omnianomaly.

the system consists in two parts, offline training and online detection.
when training, it uses pre-gathered datas, and train models for generating Anomaly Scores, Threshold selection using multivariate time series data.
and when detecting, the model processes detected data and generate anomaly score and process score with pre trained threshold selection model to get anomaly interpretation.
following first image is the model architecture of anomaly score generation model (from authors’ short model presentation video).
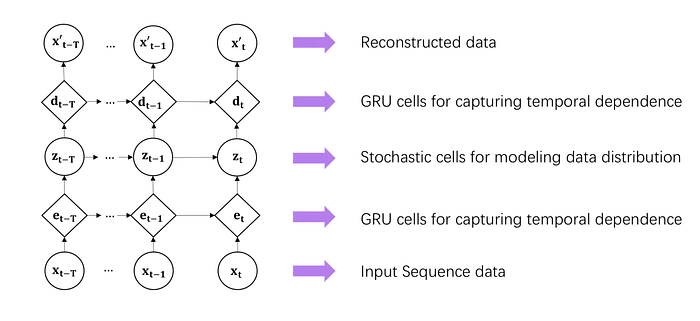
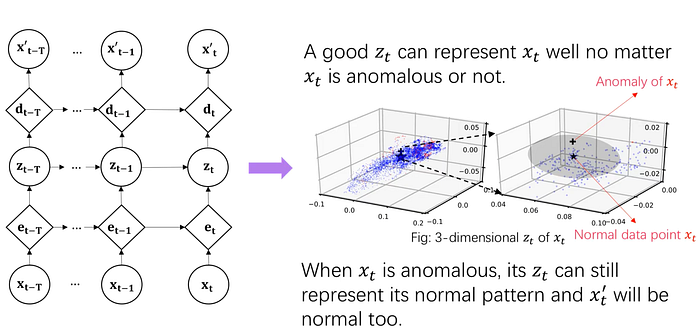
And this image is detailed network architecture of model.
left one is et generation part of first image and right one is dt generation part of first image.
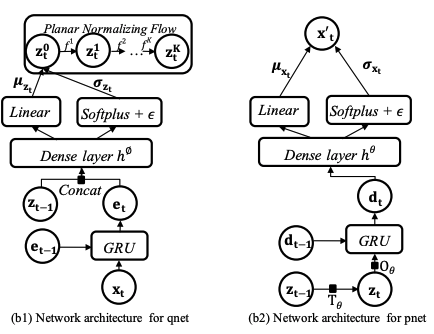
it uses VAE structures, so zt has implications about xt, and this is the main idea of Omnianomaly.
the authors thought that good zt can represent xt well, so, x’t is recovered correctly if zt trained well.
then we can think if some dimensions that recovered well, that dimension is a main reason of anomaly.
so authors saying that finding the top few dimensions of scores can interpret anomaly.
so the Anomaly Score can be the Reconstruction probability of xt.
and the system uses an threshold to interpret anomaly score that input is normal or anomalous.
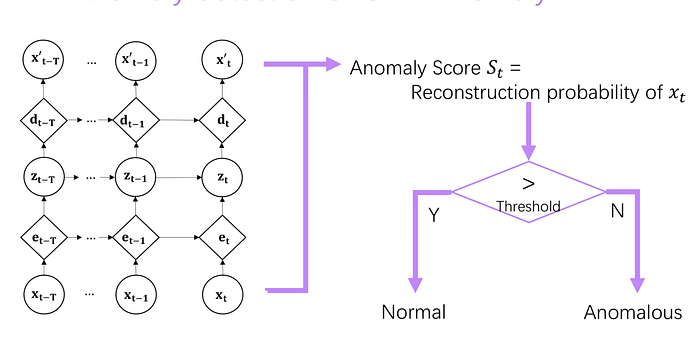
the threshold is decieded by automatically with POT algorithm.
the POT algorithm is second theroem of EVT.
EVT(Extreme Value Theory)’s goal is finding the law of extreme values and extreme values are usually placed at the tails of probability distribution.
this theory’s advantage is that there is no assumption on data distribution when finding extreme values.
And the basic idea of POT(Peaks Over Threshold) is to fit the tail portion of a probability distribution by a generalized Pareto distribution (GPD) with parameters.
GPD is a is a family of continuous probability distributions. It is often used to model the tails of another distribution.

And the authors adopt POT to learn the threshold of anomaly scores.
With trained model which outputs Anomaly Scores and automatically detected threshold, the system can detect anomaly cases, and interpret those cases.
And the performance of Omnianomaly, the authors are saying that the system has better performance than SOTA(State Of The Art) at that time.
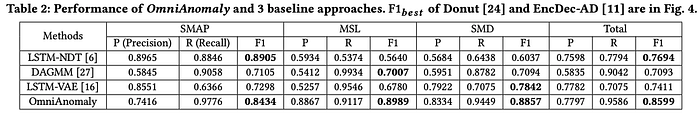
The compared models are LSTM-NDT, DAGMM, LSTM-VAE, and Omnianomaly.
The F1 score is the weighted average of Precision and Recall, the formula is as follows.
F1 Score = 2*(Recall * Precision) / (Recall + Precision)Train Omnianomaly
0. Before started
We are going to train the model in Google Colab.
use this colab and follow the instructions in 0. Before started menu
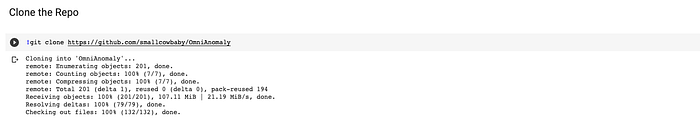
we first clone the github repo
and we set the python environments.
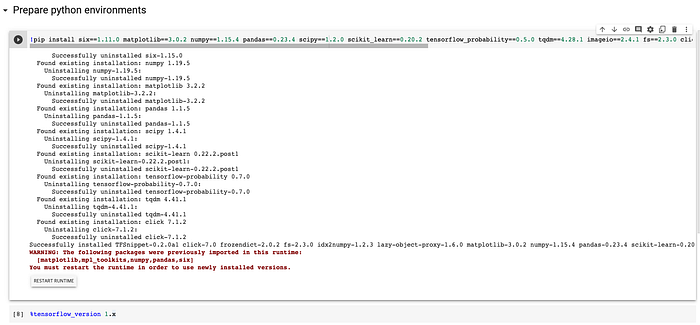
If we want to run this in desktop, we have to do some annoying things to install required tensorflow version .
(for example, install nvidia driver, exact cuda version, cudnn …)
But fortunately in Google Colab, it just solves with one magic word.
%tensorflow_versionwe use SMD dataset which is smallest dataset in the example repo.
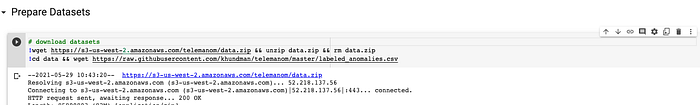
1. Dataset
we use SMD dataset provided by the example repo.
SMD is abbreviations of Server Machine Dataset, It is 5-week-long server status log dataset, which is collected by large internet company.
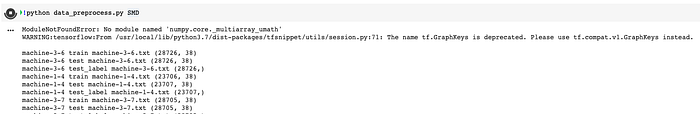
The dataset consists of the following:
- 28 entities, 38 dimensions
- 50% train(former part), 50% test(latter part) datasets
- threre is test_label, which describes whether test dataset is anomaly or not.
- interpretation_label is for what dimension is the reason of each anomaly
- 38 dimensions each means following
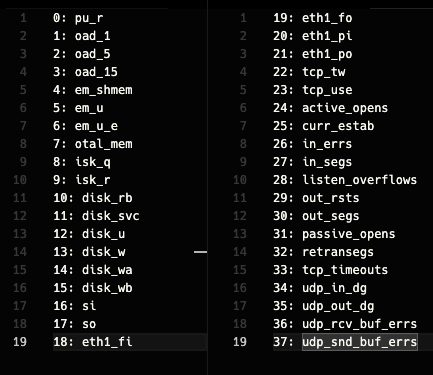
2. train
Because each training takes about 3hours, we can’t train all 28 subsets, so we just train first server only(machine-1–1)
lets start training by calling
python main.py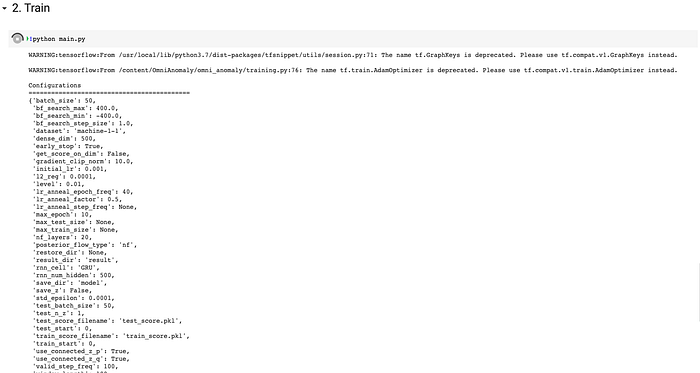
The main.py does following process.
- train model(early stop applied).
- validate at 100 step

- test model on training set, and test set.
(the results are saved in train_score.pkl and test_score.pkl) - find the best F1 score on the test set, and plot the results.
- Init POT model on
train_scoreto find the threshold of anomaly score, and using this threshold to predict on the testing set.
running main.py takes about 3hours, so after running, Why don't you relax with a cup of coffee?
the result checkpoint saved in result/train_score.pkl and result/test_score.pkl
3. test results.
after training we get train_score.pkl and test_score.pkl.
using these scores we are going to check the trained model can detect test set correctly.
from omni_anomaly.spot import SPOTfrom omni_anomaly.eval_methods import adjust_predicts, calc_point2pointimport pickleimport osimport numpy as npdef load_pickle_data(path): with open(path, "rb") as f: return pickle.load(f)train_score = load_pickle_data("./results/train_score.pkl")test_score = load_pickle_data("./results/test_score.pkl")all_label = load_pickle_data("./processed/machine-1-1_test_label.pkl")test_label = all_label.reshape((-1))[-len(test_score):]s = SPOT(1e-3) # get POT model.s.fit(train_score, test_score) # Fit train_score and eval_scores.initialize(level=0.005, min_extrema=True)ret = s.run(dynamic=False) # runprint(len(ret['alarms']))print(len(ret['thresholds']))pot_th = -np.mean(ret['thresholds']) # get pot threshold# check test set is whether anomal or normalpred, p_latency = adjust_predicts(test_score, test_label, pot_th, calc_latency=True)# Calculate F1 score between predicted labels and real labels.p_t = calc_point2point(pred, test_label)print('POT result: ', p_t, pot_th, p_latency)
The Results are following.
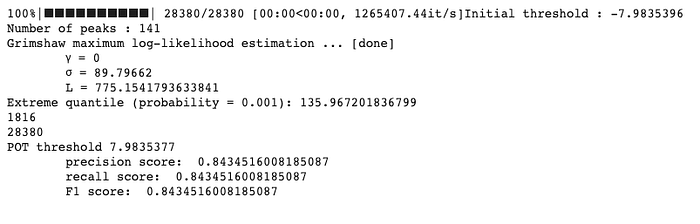
you can get precision, recall, and f1 score, values that I get is same as what is presented in paper.
